This page gives details on the widgets that are in the “Air” subsection. They can be accessed by customizing the XCTrack Pro pages pre-installed on AIR³. Remember that your customisations will be lost if you reset XCTrack Pro interface with AIR³ Manager, if you change the profile (Kiss, Easy, Expert, Paramotor) or if you load a different configuration file ‘xcfg’.
Click on the + sign to read the details.
[accordion][spoiler title=”Wind speed” open=”yes” style=”default” icon=”plus” anchor=”” class=””]
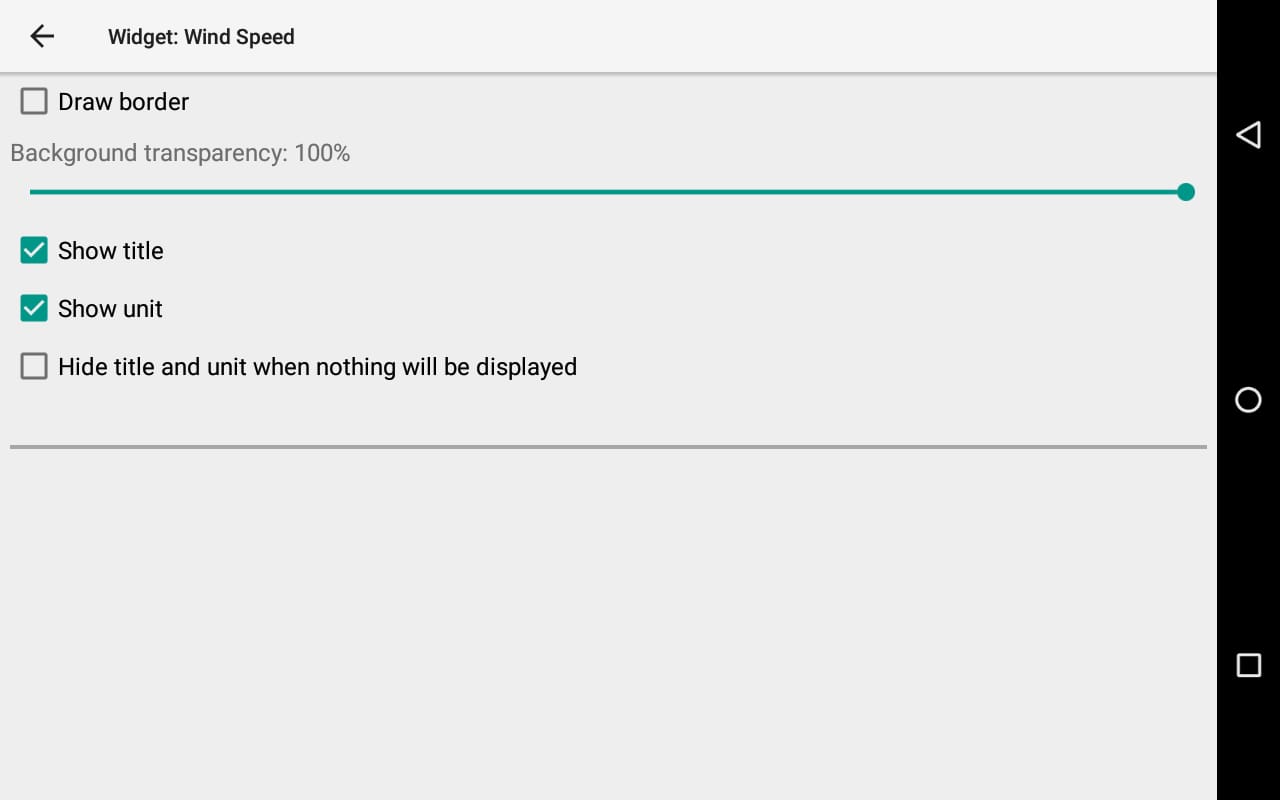
Computed wind speed strength.
The wind speed is computed after completion of a full circle.
Units can be changed in Menu/Preferences/Display/Units/Wind speed.
Wind speed and wind direction (based on the arrow provided by the compass widget) are available on all pages preconfigured with AIR³.
Wind speed can also be obtained from an external sensor. Read more details about Wind and Airspeed data coming from an external source in the Connection & Sensors section of the Preferences page of XCTrack Pro Manual.
Wind speed from weather stations around you can also be obtained from a webpage widget. Read more details about how to configure a webpage widget using Windspion URL here.
Use this barcode to configure the URL:

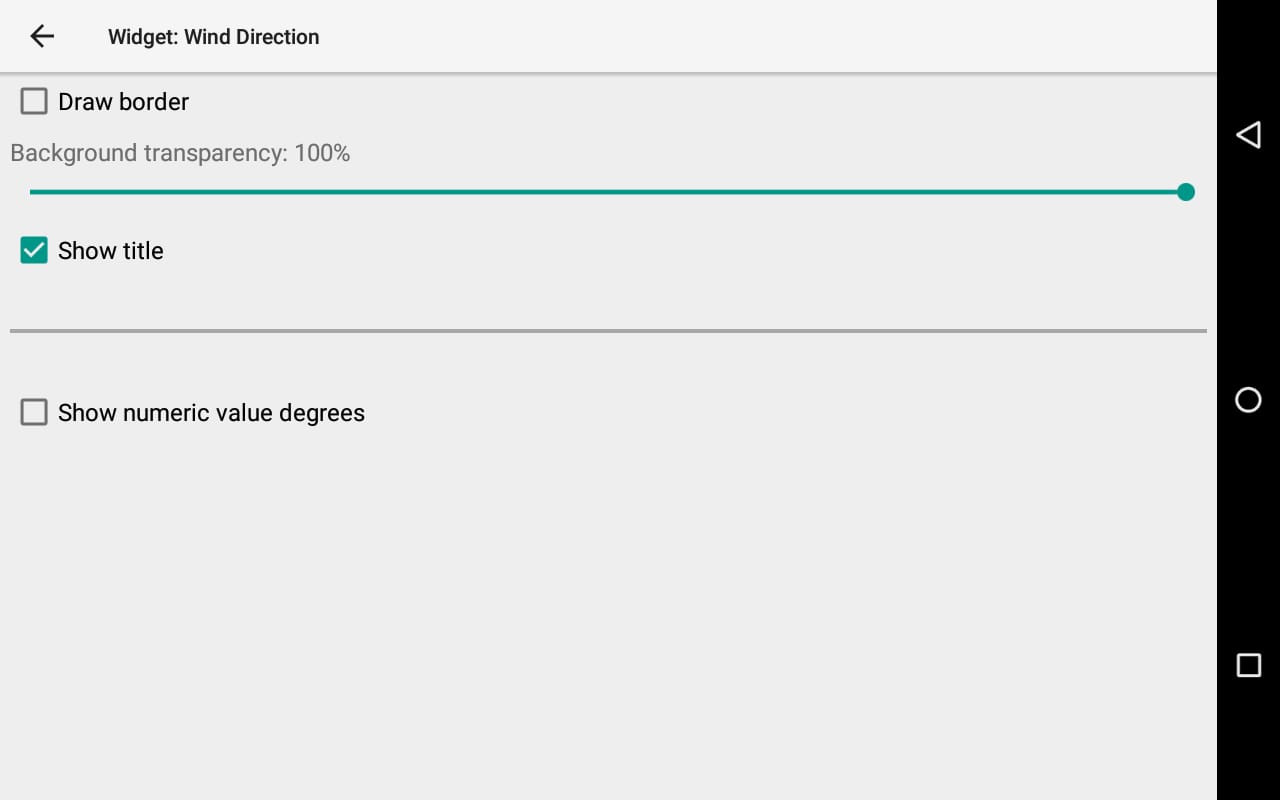
Computed wind direction.
The wind direction is computed after completion of a full circle.
You can display it as cardinal direction letters or as numeric values ( ex: 90° = E ).
Wind speed and wind direction (based on the arrow provided by the Compass widget) are available on all pages preconfigured with AIR³.
Wind can also be obtained from an external sensor. Read more details about Wind and Airspeed data coming from an external source in the Connection & Sensors section of the Preferences page of XCTrack Pro Manual.
Check also the Digital Compass widget in the Navigation page of XCTrack Pro Widgets manual. The Digital Compass widget displays the numerical value of the wind direction, either as an absolute value ( ex: 90° = E ), or relative to your bearing.
Do not confuse between the Thermal Assistant Page (Menu/Preferences/Pages Layout/ and the Thermal Assistant Widget (Menu/Customize/Add widget/Air/Thermal Assistant).
The thermal assistant widget can be added on any page but automatic actions only affect the Thermal assistant page.
Switching to thermal assistant can be enabled or disabled in Menu/Preferences/Automatic actions. By default, once circling in thermal is detected, the page is switched to the thermal assistant page. Once XCTrack detects the pilot stopped thermalling, the page is automatically switched back. The detection of thermalling start/end is based on the following rules:
- XCTrack detects start of thermalling if there has been at least 90° change in heading (not bearing) in last 30 seconds AND the vertical speed averaged over last 30 seconds is -0.5m/s or more (less the 0.5m/s sink or lift)
- XCTrack detects end of thermalling if there have been less than 30° change in heading in last 30 seconds AND the vertical speed averaged over last 30 seconds is less than -0.5m/s
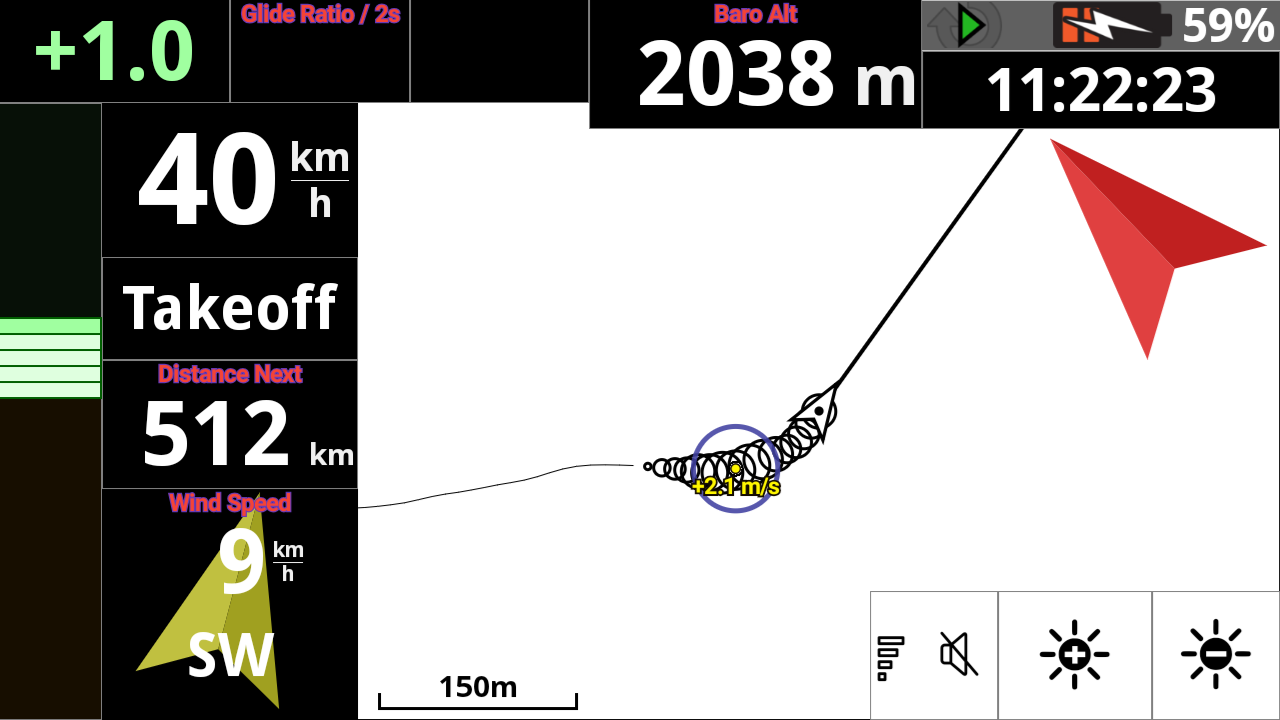
The thermal assistant is a great feature to identify, center and find back a thermal.
Depending on the theme chosen, the strength of the lift is displayed through a variation of colors ( for Black and White theme) or through the size of the circles (for eInk theme).
With its large screen, AIR³ provides an outstanding feature through this thermal assistant widget.
You can choose a theme for the Thermal assistant widget that differs from the main theme. This can be quite convenient for the Thermal Assistant widget, so that you can get the benefit from the Black theme to reduce energy consumption for the main widgets and still use eInk theme for the Thermal Assistant so that you can easily see the thermal strength according to the size of the circles that are displayed on the Thermal Assistant map.
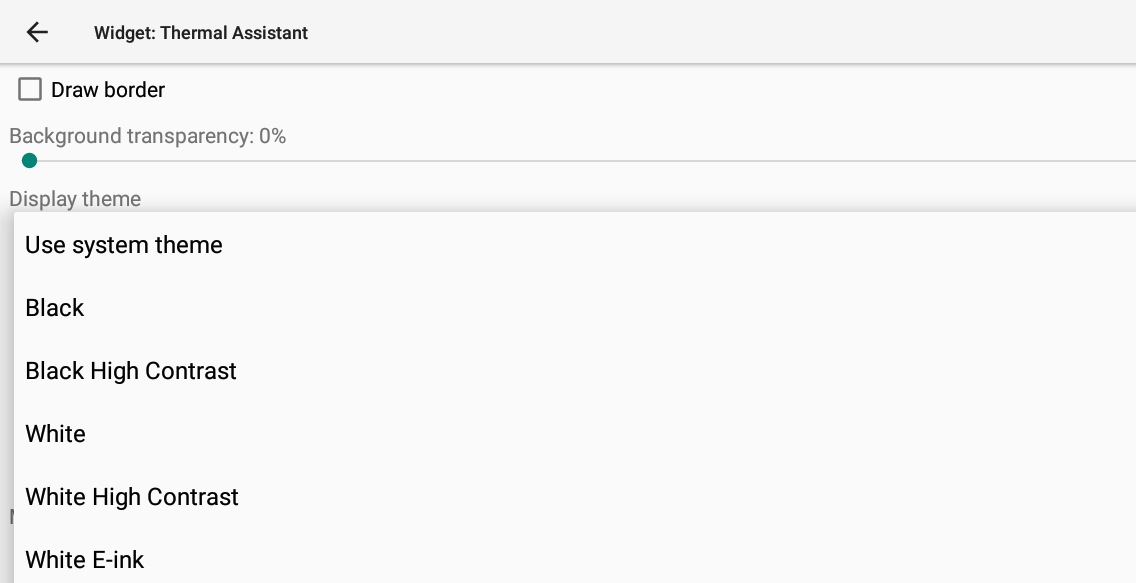
By clicking on the + sign, you can configure the map or configure when Airspaces are displayed.
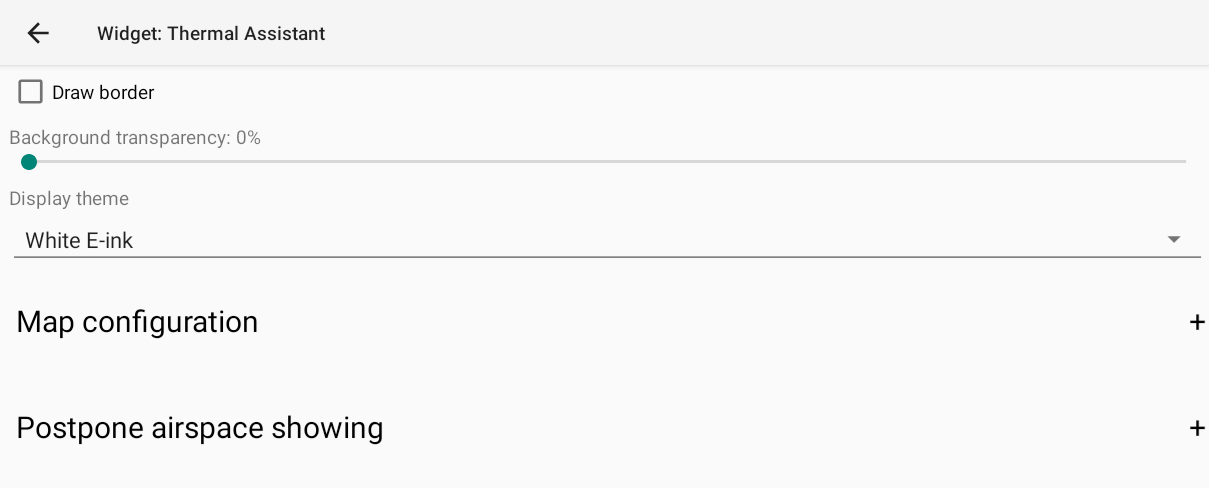
[_spoiler title=”Map configuration” open=”yes” style=”default” icon=”plus” anchor=”” class=””]
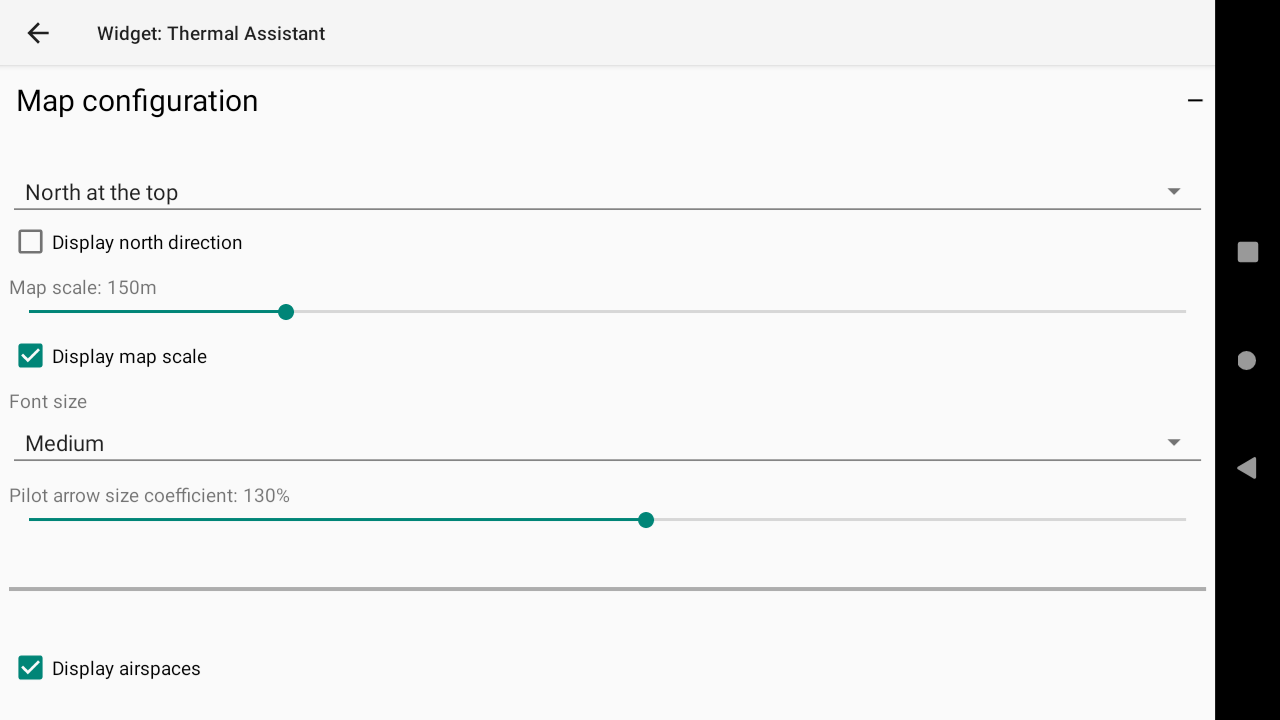
You can configure what should be at top, display a small compass on the map to indicate north direction , define the map scale, determine the size of font used to display information on the map such as the climb rate and decide if you want the airspaces to be displayed on that map.
Thanks to its large screen, using the AIR³ for free flight with rather slow aircrafts (paragliding or hanggliding), it is recommended to scale the map @ 150 m. This will allow you to see the thermals accurately, while keeping a perspective far enough apart to properly identify the thermal. Using AIR³ with faster gliders, you may be more comfortable to scale it @ 250-400m.
As the Thermal Assistant Map displays a “moving map” (see below for more details), it makes no sense to display Terrain or Roadmap information.
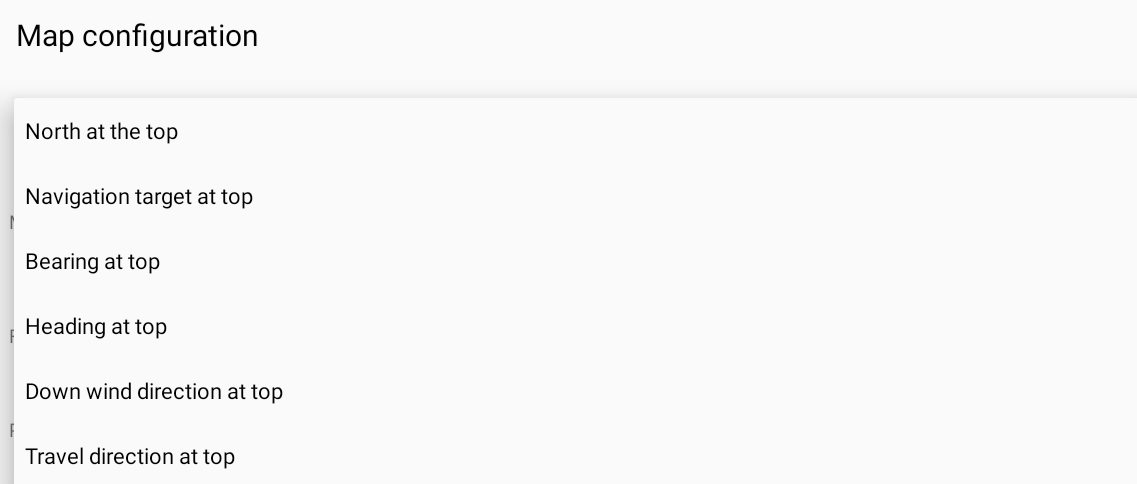
Using AIR³ for free flight, it is recommended to keep north at top, combined with the map that is moving with the wind (see “how to include wind into computation”). This gives you the best way to center the thermal or to find it back when lost.

The Thermal Assistant page goal is to assist you to find thermals, not to navigate. So, it doesn’t make sense to set the top of the map with bearing or heading at top. However, as it is available for other map configuration, you can decide to change the top of the map with Navigation target at top, Bearing at top, Heading at top, Downwind direction at top or Travel direction at top .
Downwind direction at top requires to have computed the wind direction. So, in any case, the map will get North at top at the beginning of the flight. Read more details about Wind direction computation in the Wind direction widget description in the Air section page of the XCTrack Pro Widgets Manual.
Travel direction at top requires to have computed the travel direction. So, in any case, the map will get North at top at the beginning of the flight.
Travel direction gets changed when BOTH of these conditions are satisfied
– the user has traveled for more than 3 km in 20 minutes
– the user has been travelling directly for about 2 minutes
… Then, the direction is changed, with preference for the angle travelled if it doesn’t differ too much from the 2 minutes bearing.
![]()
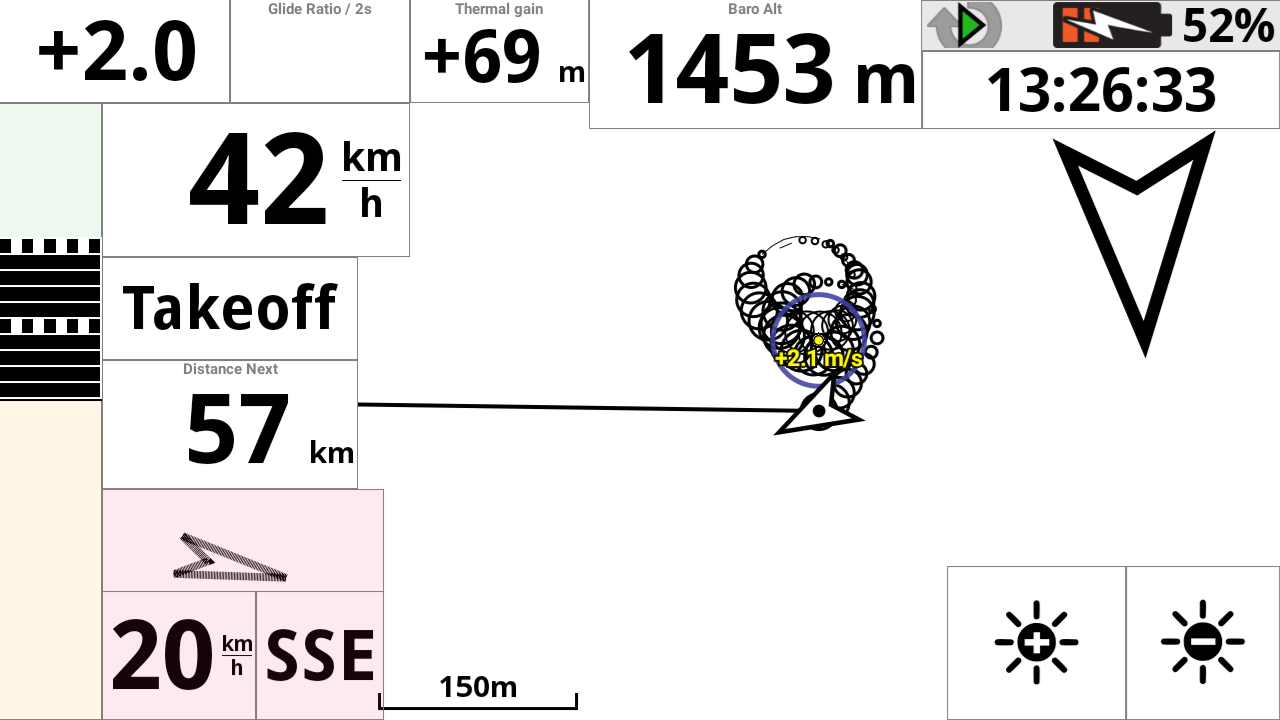
You can modify the Pilot arrow size to better identify the current Heading by increasing the coefficient.
Depending on the wind direction and strength, you can therefore better visualize at any moment the Heading (Pilot arrow) and the Bearing (Line in front of the pilot).
By default, XCTrack uses the Bearing/track direction thanks to the GPS, the wind speed and direction to compute the Heading direction.
By enabling “Use internal compass” in Menu/Preferences/Connection & sensors, XCTrack uses the information coming from the internal compass to display the Heading.
Read more details on using the internal compass in the Preferences page of XCTrack Pro manual.
[_spoiler title=”Postpone airspace showing” open=”yes” style=”default” icon=”plus” anchor=”” class=””]

By setting in the map configuration to display airspaces, the airspace whose floor is above the set limit can be deferred. Approaching a set distance, the deferred airspace can be displayed.
By using the expert mode of AIR³, a dedicated page is available for airspaces management. Therefore the airspaces are not displayed on the Thermal Assistant map to increase thermals identification.
If you are interested to know more about Airspaces with AIR³, watch the dedicated tuto video in the videos’ page.
[_/spoiler]
If you are soaring at the same place, the tracklog length should be limited to avoid creating a mess on the map with too many tracklogs at the same place.
On the other side, with a longer length, the lost thermal may be found back more easily.
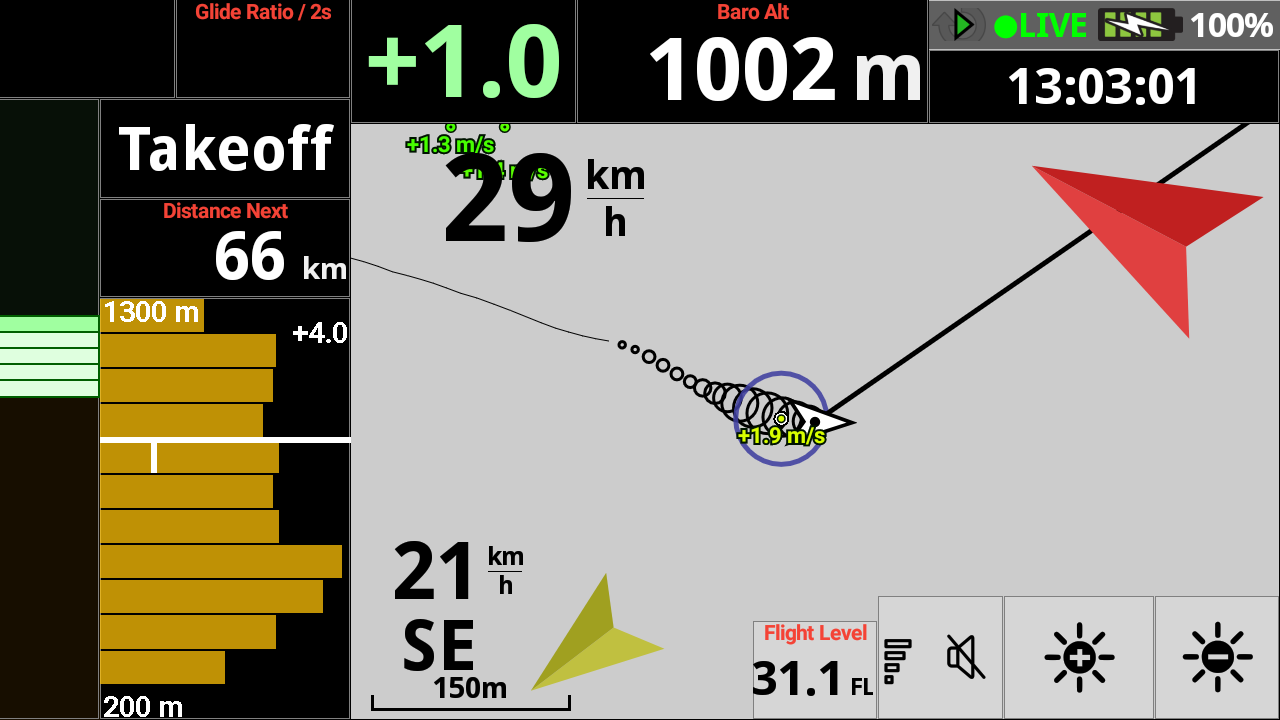
A thermal has a vortex shape with higher climb rates in the center. Once you start thermaling, XCTrack will compute the climb rates information to identify the center of the thermal. This thermal center is marked by a circle by activating the “show circle around nearest thermal” flag.

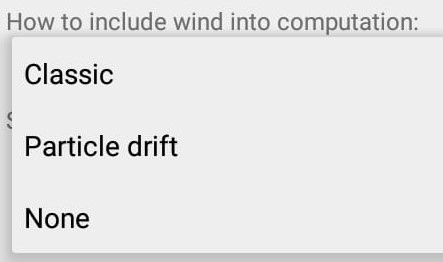
The wind computation to display the thermal (displayed points) is a great feature to determine the shift of the thermal by the wind.
Classic, means that the thermal (displayed points) are based on the coordinates of original points to whom a drift is added according to the computed wind.
Coordinates of displayed point = original point + drift * point’s age.
Particle drift means that the coordinates of displayed points are influenced by the altitude difference. Particle drift is based on another algorithm that tries to determine the shift of the thermal by wind based on the idea that a stronger thermal is less influenced by the wind than a weak one.
Coordinates of displayed point = original point + drift * (current altitude difference / (vertical speed + 1))
It can actually work pretty well – but it depends on the weather (wind speed, thermal strength) and on pilot style.
“Classic” works better in general use – so it’s default. But some pilots may think “particle drift” is a better choice.
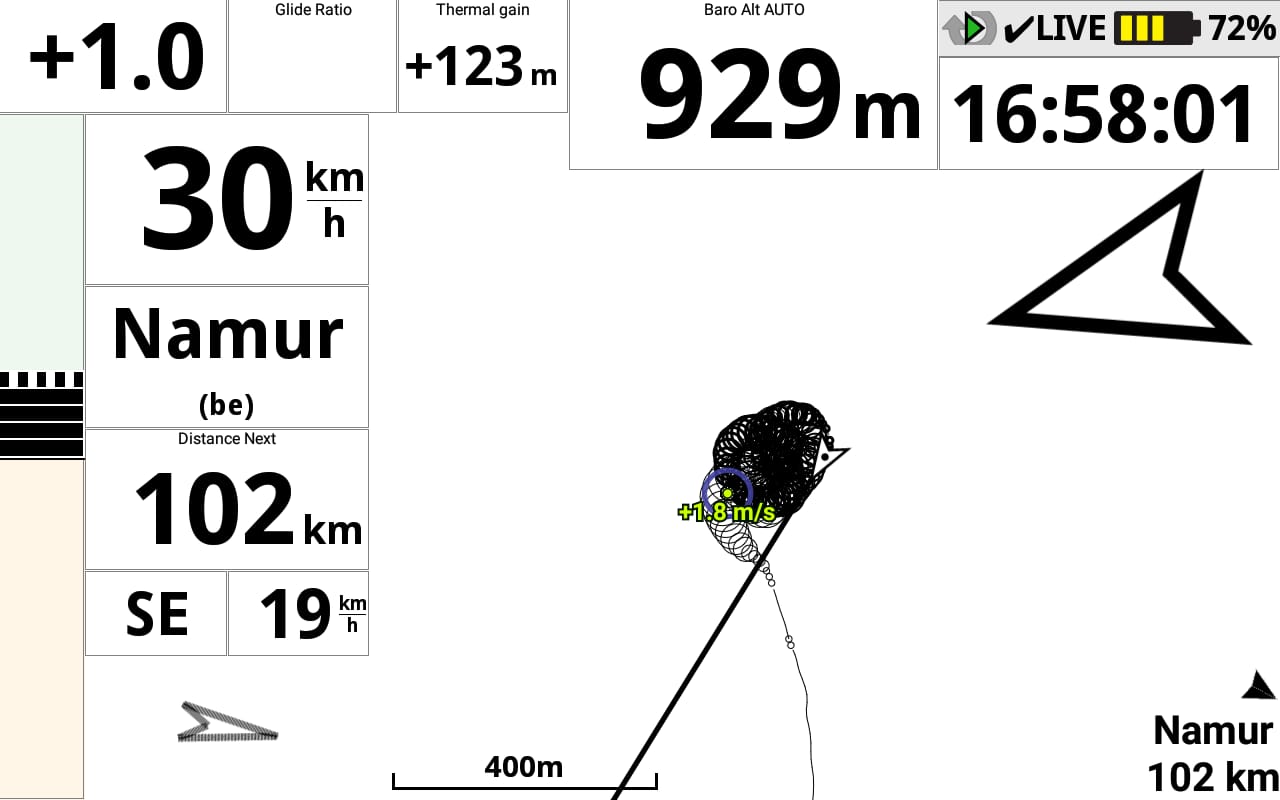
None.
If you don’t want the thermal info to be computed to “move” the map of such displayed points accordingly, “none” will “fix” the map. You will need to determine by your own where the lift is going. As you are usually circling, you will see on the map a corkscrew.
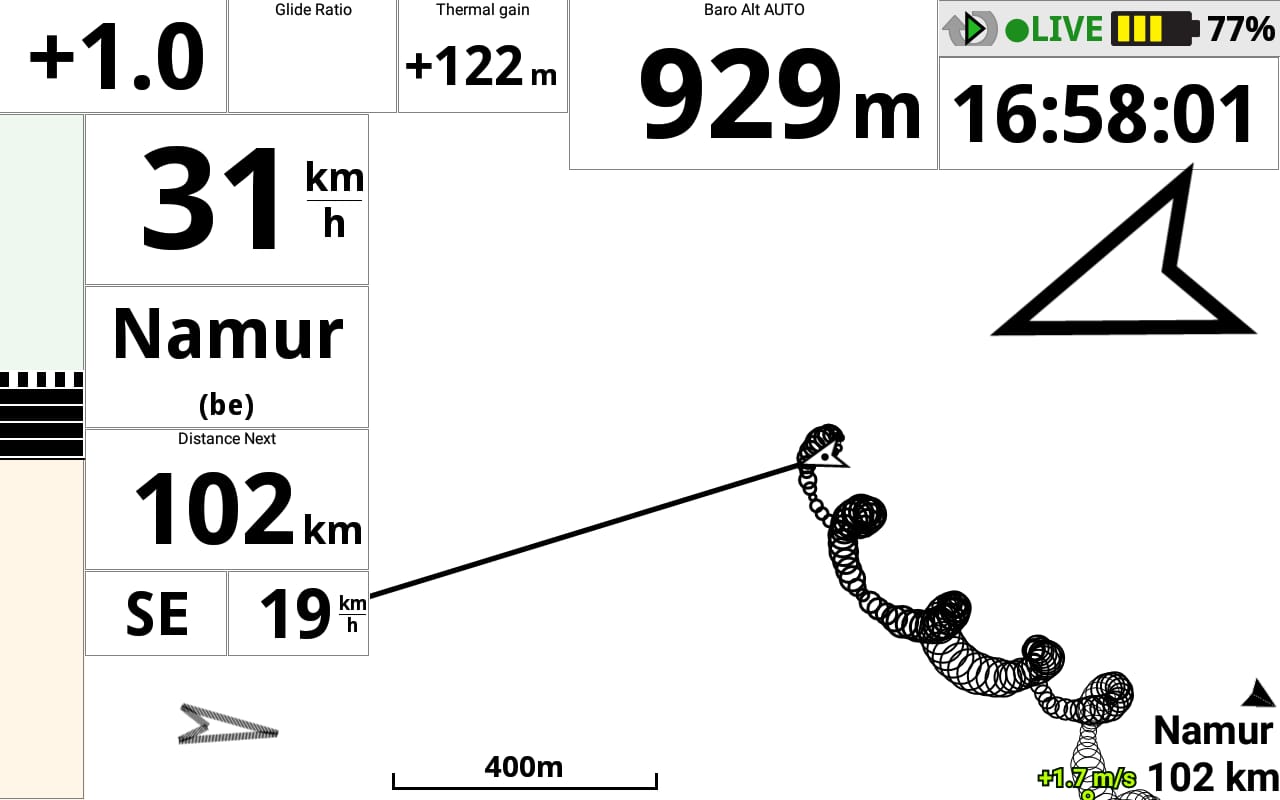
Classic
The map of displayed points is moving according to the computed wind.
With AIR³, navigation is mainly managed by other pages. The main arrow that indicates the direction of the target is included on every page. To avoid creating confusion while trying to identify the thermal, navigation is set to “Do not use” on the Thermal Assistant widget.
However, here are some details if you want to display navigation instructions directly on the Thermal Assistant widget. Two different options are offered:
- Type of navigation mode (Point, Optimized point, Cylinder (nearest point) or Do not use.
- Activate “distinguishing brackets” in order to quickly identify your previous settings:
Point mode [Optimized point] (Cylinder)


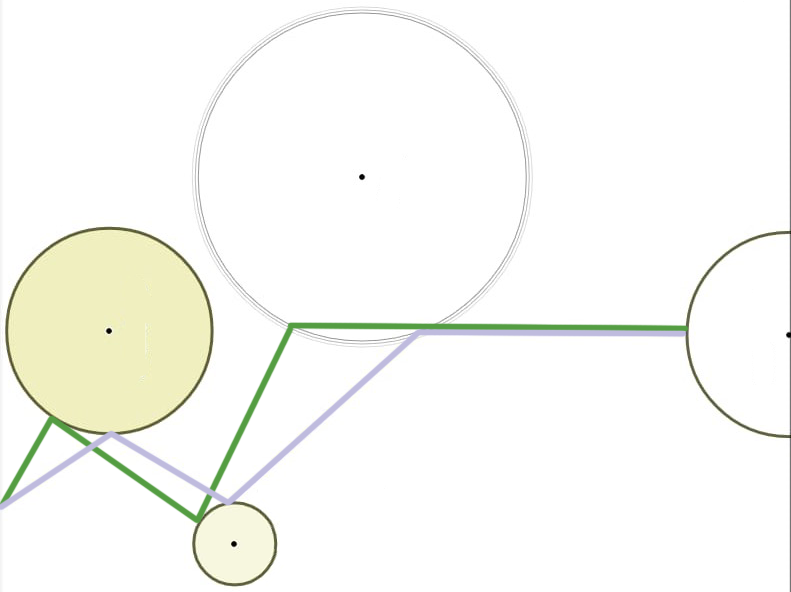
Different settings are available for navigation depending on your preferences:
- “Point” indicates the direction to the exact target. Green line. The difference with “Cylinder” is that the distance, glide, time,etc. are calculated up to the point/target. However, once the circle around the target is reached, the navigation will switch to indicate the next point.
- “Optimized point” indicates the direction to the optimized point depending on your route. This is the most used setting. Blue Line.
- “Cylinder (nearest point) indicates the direction of the nearest point of each circle once the previous is reached. Green line. The difference with the “Point” is that the distance, glide, time, etc. are calculated up to the circle to reach.
- “Do not use” is the setting to not show navigation.
The last parameters are self explanatory.
Wind is computed after completion of a full circle.
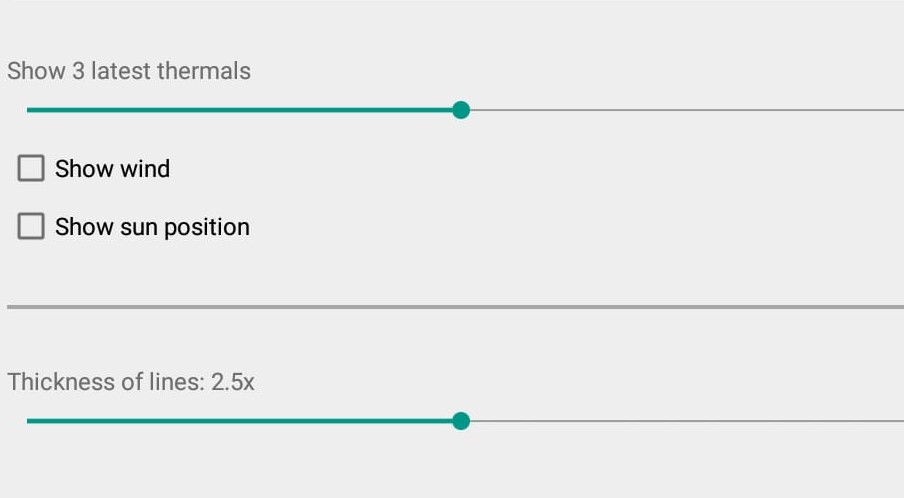
Screenshot with wind and sun position:

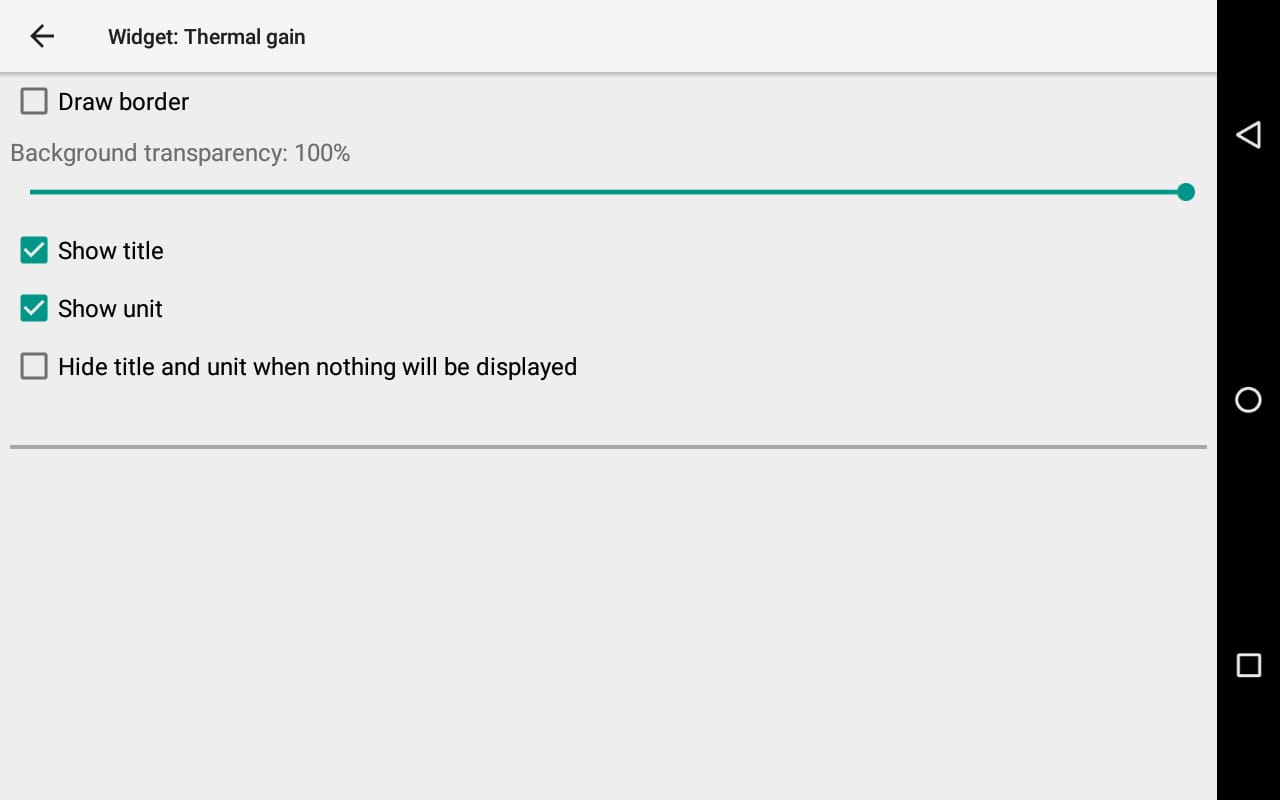
Altitude gain in current thermal.
XCTrack Pro remembers the altitude when start of thermalling is detected. The detection is based on minimum 90° of heading change and vario change threshold during a given interval.
The widget shows the difference between current altitude and the remembered one corresponding to the start of thermalling.
Units can be changed in Menu/Preferences/Display/Units/Altitude
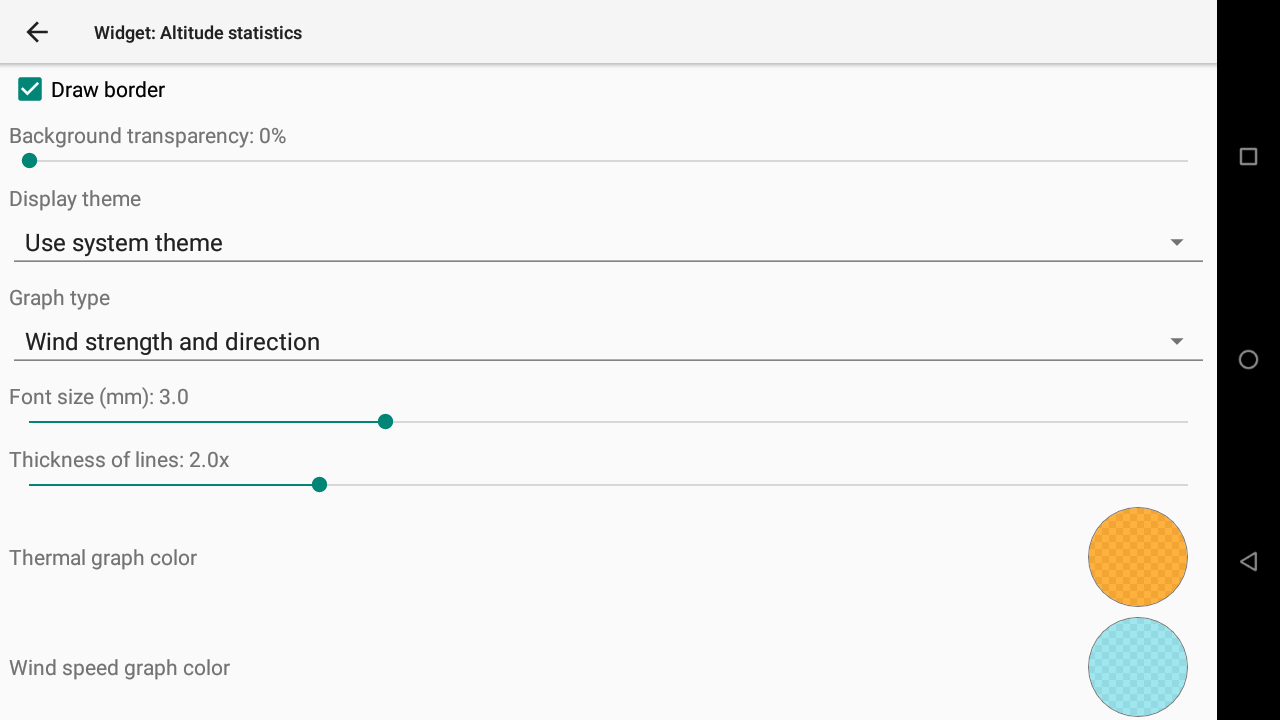
Altitude statistics widget displays a graph with statistics according to the different altitudes (Standard altitude is used when available).
You can set the graph type, the font size, the thickness of lines and choose the graph color according to the graph type displayed.
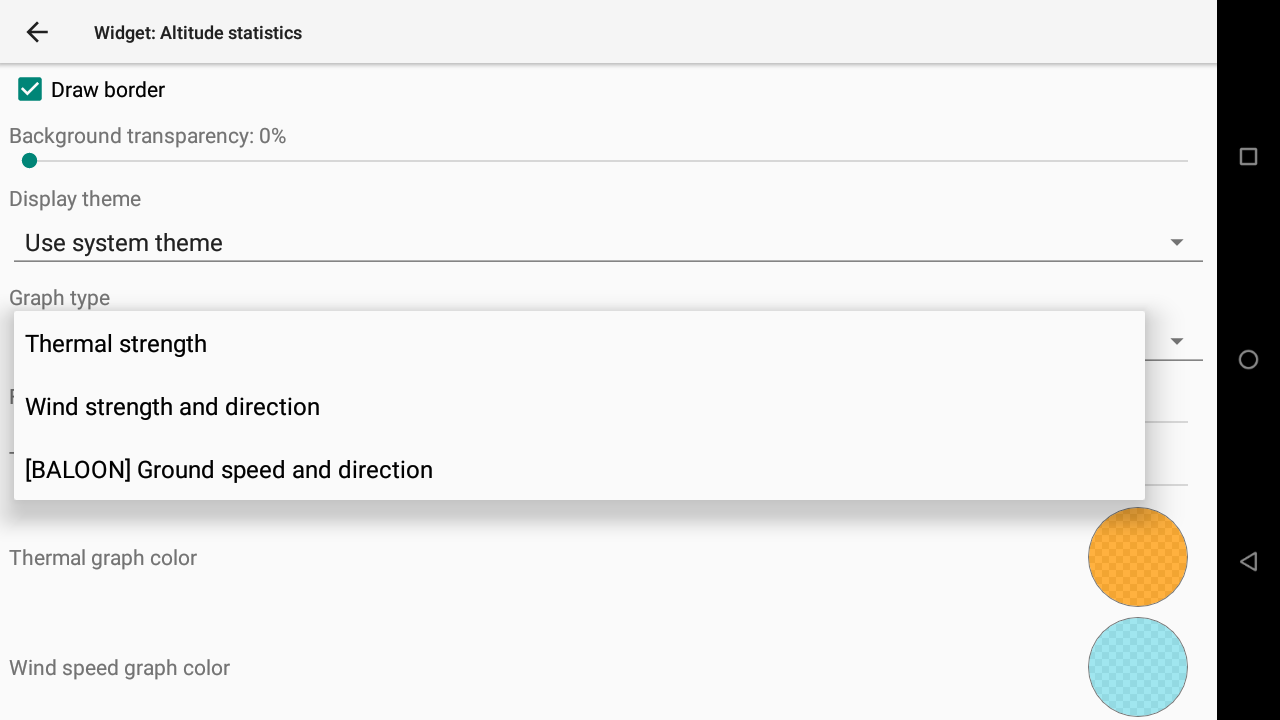
You can choose 3 types of graph: Thermal strength, Wind strength and direction or Ground speed and direction (for balloon).
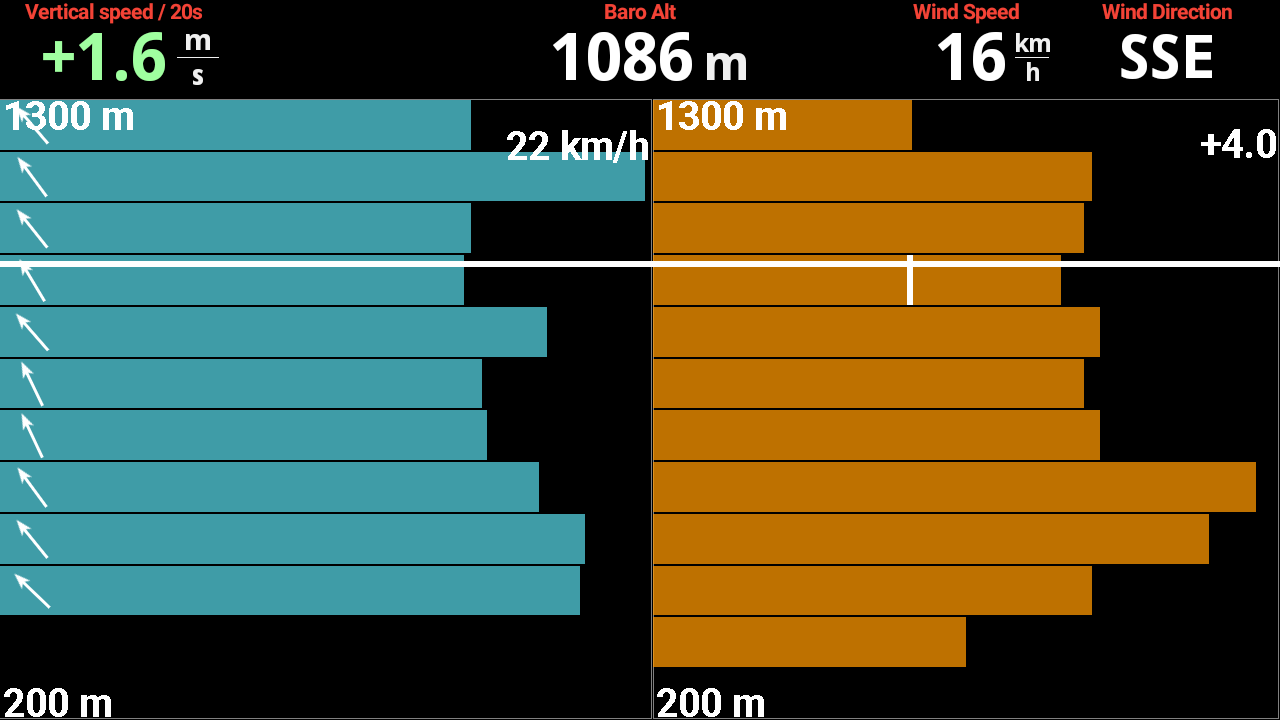
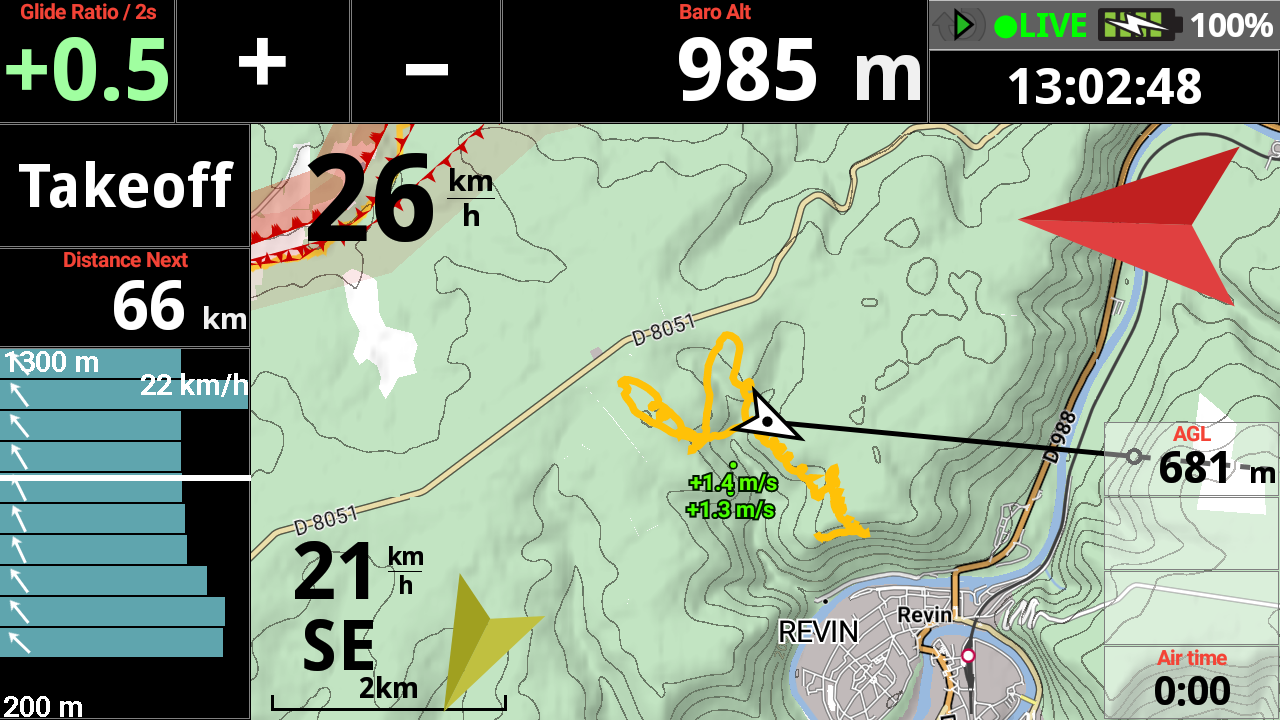
Thermal strength displays a graph with the different thermal strengths for each slice of 100m of altitude. The horizontal line corresponds to the current altitude. The vertical line corresponds to the current lift.
Wind strength and direction displays a graph with the different wind strengths for each slice of 100m of altitude, as well as the small arrow indicating the wind direction. The horizontal line corresponds to the current altitude.
Ground speed and direction displays a graph with the different ground speed for each slice of 100m of altitude.
The vario value (thermal strenght) is averaged for 20 seconds. The maximum value is kept for 40 minutes, but, for the next 40 minutes, the maximum is linearly aged, so that after another 40 min the maximum is 0.
For example, let’s say you have just reached a maximal climb of 1 m/s. For the next 40 minutes everything has to be higher to be taken into account. But after one hour from the 1 m/s (60 minutes) the stored maximum will be aged to 0.5 m/s: 40 minutes the initial period then half of the aging period (20 minutes) -> value is aged by half -> everything bigger than 0.5 m/s will be the next maximum.
Ground speed. This parameter was initially intended for balloonists. The value is taken into account if you fly straight enough (the standard deviation in bearing change for the last 5 s is less than 8.
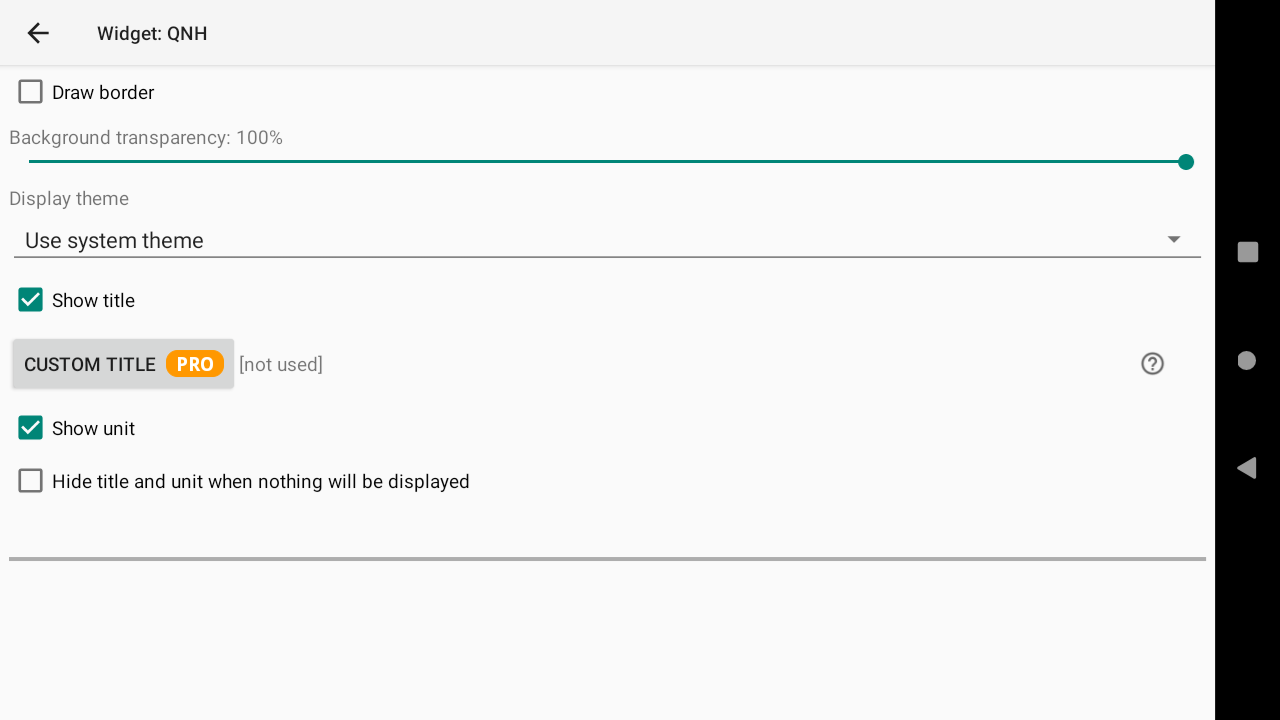
QNH is the air pressure you get at your location, converted as if you were at sea level. If you set correctly your QNH, you should be able to get your exact altitude according to the pressure because there is a direct link between the altitude and the pressure drop once you climb.
The current QNH is set in Menu/Preferences/Altimeter/QNH settings.
QNH can be set automatically through internet (Pro version) thanks to Metar or Weather station, … or through the GPS altitude.
It can also be set manually.
Next section:
